Skip to content
Statistical Outputs
-
-
- Correlation coefficient (r, R2) – measures the strength and direction of a linear relationship between two variables. The range of the correlation coefficient is from -1 to 1. If there is a positive relationship between the variables, the value of r will be close to 1. It is used in a Linear Regression test (also known as the Line of Best Fit).
- Degrees of Freedom (DF) – the number of values that are free to vary after a sample statistic has been computed. It is defined as 1 less than the sample size (n-1). It is necessary to compute this value for many statistical tests.
- Measure of Central Tendency – generally researchers find values somewhere around the middle of the range of observed values. These measurements help characterize a population. These measurements include the mean, median and mode.
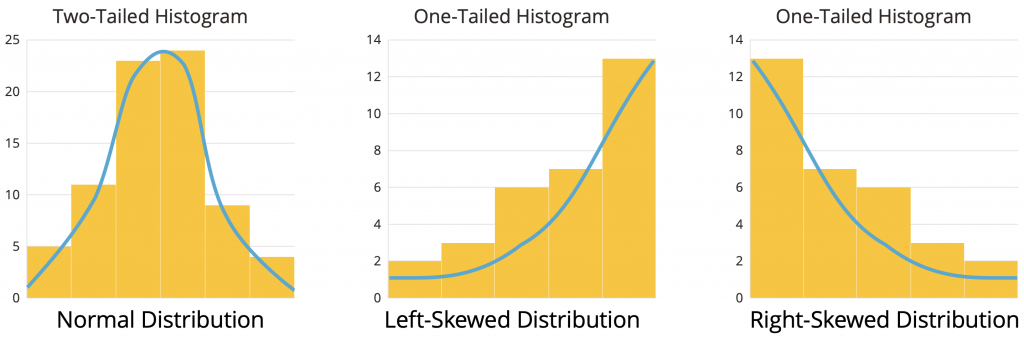
- Normal Distribution – is a continuous, symmetric, bell-shaped distribution of a variable. The “tail” of the curve indicates the direction of skewness the data values are in relation to the mean.
- P-value – The p-value (probability value) tells you the likelihood that there is a real difference between your means or if it’s just a coincidence. In research, a statistically significant p-value is 0.05 or less.
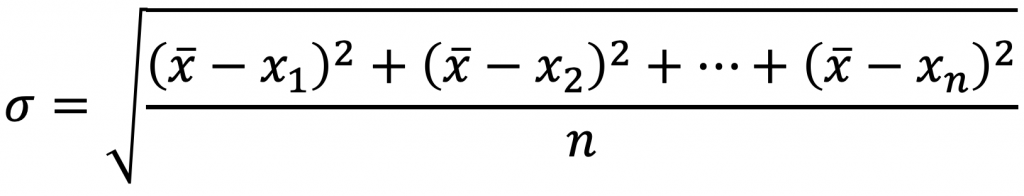
- Standard Deviation (𝜎) – is the measure of how “spread out” the data are. It is the most widely used measure of variability. It is the average distance the data points lie from the sample mean. To calculate the standard deviation, take the square root of the variance.
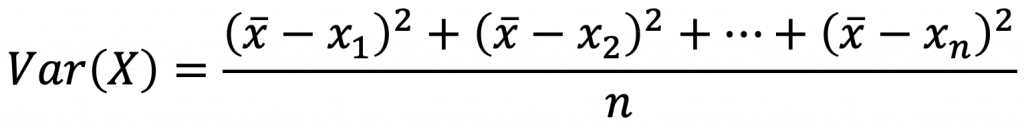
- Variance – the average of the squares of the distance each value is from the mean.
Hypotheses
- Alternative hypothesis (H1) – states that there is a difference between parameters.
- Null hypothesis (H0) – states that there is no difference between parameters. (symbolized by H0)
Populations and Samples
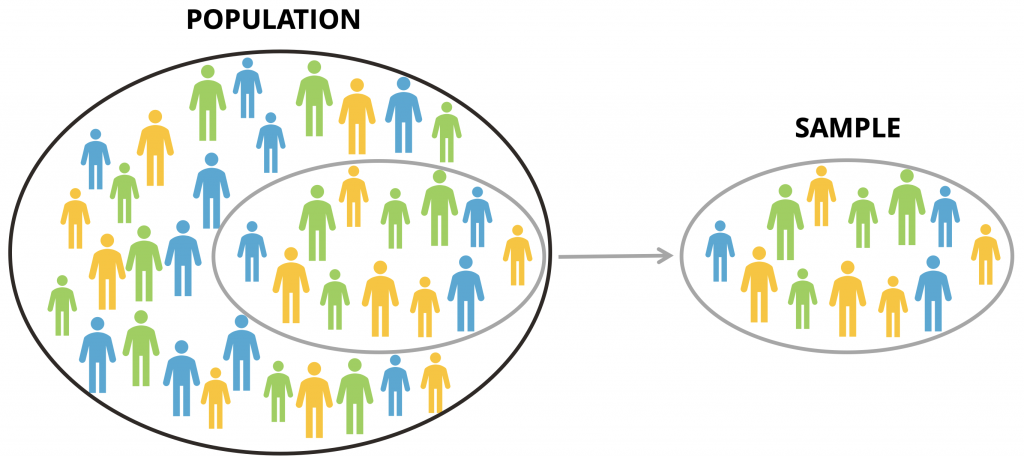
- Population – all individuals representing the group you wish to study. Examples include the entire human population in the world, all bobcats in the world, or all white pine trees in the world.
- Sample size (n) – the subset of individuals observed from a population. It would be nearly impossible to measure an entire population. Instead, you study a sample or portion of the population. From the characteristics of your samples, you can draw conclusions about the characteristics of the population. The larger your sample size, the stronger your conclusions about the entire population will be. Sample size is always represented as n in statistics.
- Parameter – a quantity that describes or characterizes a population. It is rare to be able to calculate accurate population parameters. However, by taking samples of populations, parameters can be estimated very well.
- Statistic – a quantity that describes or characterizes a sample. Because it is almost always impossible to sample an entire population, researchers take samples in order to draw conclusions about populations. A statistic representing a population parameter is always abbreviated using a Greek or Latin letter.
Variables
- Continuous Variable – a variable that you quantify by measuring. all values between any two specific values, obtained by measuring. Examples include length, mass, and time.
- Discrete Variable – a variable that you quantify by counting or splitting into categories. Examples include days of the week, number of people, or how many times an event occurs.