Increasingly, scientists, citizen data collectors, college students, and even journalists are using existing data sets in conjunction with powerful data tools to explore patterns and test hypotheses. The NSF-funded Data Clubs project (developed by the Maine Mathematics and Science Alliance and TERC) addresses the lack of opportunities for middle school students, especially those from under-represented groups, to have engaging experiences with data science. The project seeks to bring data science to participants who might otherwise not encounter it, to encourage them to seek more opportunities to engage with data and to view data science as inviting and empowering. Achieving this goal requires focused, innovative materials that consider the capabilities and interests of middle school youth while taking advantage of the proliferation of available datasets and new data visualization tools, such as Common Online Data Analysis Platform (CODAP).
Our work in designing Data Club modules currently focuses on two modules, each taking place over a 10–hour period in afterschool programs or summer camps. One of the modules focuses on social media, a compelling topic for youth who spend an average of 7 hours per day on “screen time.” We recently tested this module with 11–14 year olds at a summer program in Malden MA, making use of a 2014 data set developed by the Pew Research Center. Interestingly, students viewed this data set as being “old” and made many claims about the differences between their own use of social media (in summer of 2018) and the patterns that the Pew Center researchers found. This module engaged students and we began to study their “data dispositions,” which at this point we conceptualize as follows:
- the understanding that data can address a question in ways that opinions or personal experience cannot;
- comfort with being awash in messy data
- interest in data representations (making, revising, reading)
- comfort with questions about data being iterative
- curiosity to search out functions, relationships, and comparisons.
The second module we are testing, which we have piloted with our partner Gulf of Maine Research Institute in Portland, focuses on Lyme disease and how the spread of the disease correlates with various climate indicators. We obtained data sets from both the Centers for Disease Control (CDC) and the National Oceanic and Atmospheric Association (NOAA) for students to explore. Although we have only worked with a small number of students we found that this is a compelling topic for Maine youth, as the rate of Lyme disease has increased tenfold during their lifetimes (the period from 2006-2016.)
The data tool we are using in both modules is (CODAP) (Finzer, 2016). We found that youth can master many aspects of this tool in a period of an hour or two, sometimes more quickly than adults can!
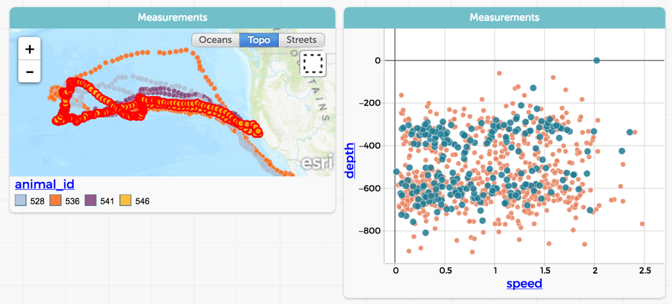
This tool makes it possible to view both geospatial and distributional data simultaneously and to see the connections between locations and other values. The figure below displays an example of this kind of analysis, in which we can see both the swimming routes of four different elephant seals off the coast of California and a scatterplot of their speed vs. their depth. These two graphs are linked; all of the points corresponding to one of the seals (#546) are highlighted in both graphs, so we can see its route and how its speed varied with depth.

We hope that our work with the Data Clubs project will make many contributions to the field, including:
- research on how data dispositions develop in young people;
- an understanding of how out-of-school learning environments can enhance learning in a discipline which, for the most part, hasn’t yet made its way into schools;
- research on how youth begin using data sets (along with data tools) to investigate their own scientific questions; and
- an understanding of ways in which different populations, including rural and urban youth, girls and boys, as well as youth of color make sense of data science.


